Understanding Softprobe Concepts
Learn how Softprobe works, its architecture, and core principles for effective observability.
📋 Overview
Softprobe is a comprehensive observability platform designed for modern cloud-native applications. It provides:
- Full-stack tracing across services and user interactions
- Performance monitoring with rich context and correlations
- Authentication-centered architecture with public key authentication
- Kubernetes-native integration for seamless deployment
🏗️ How Softprobe Works
Architecture Overview
Softprobe operates through a distributed architecture:
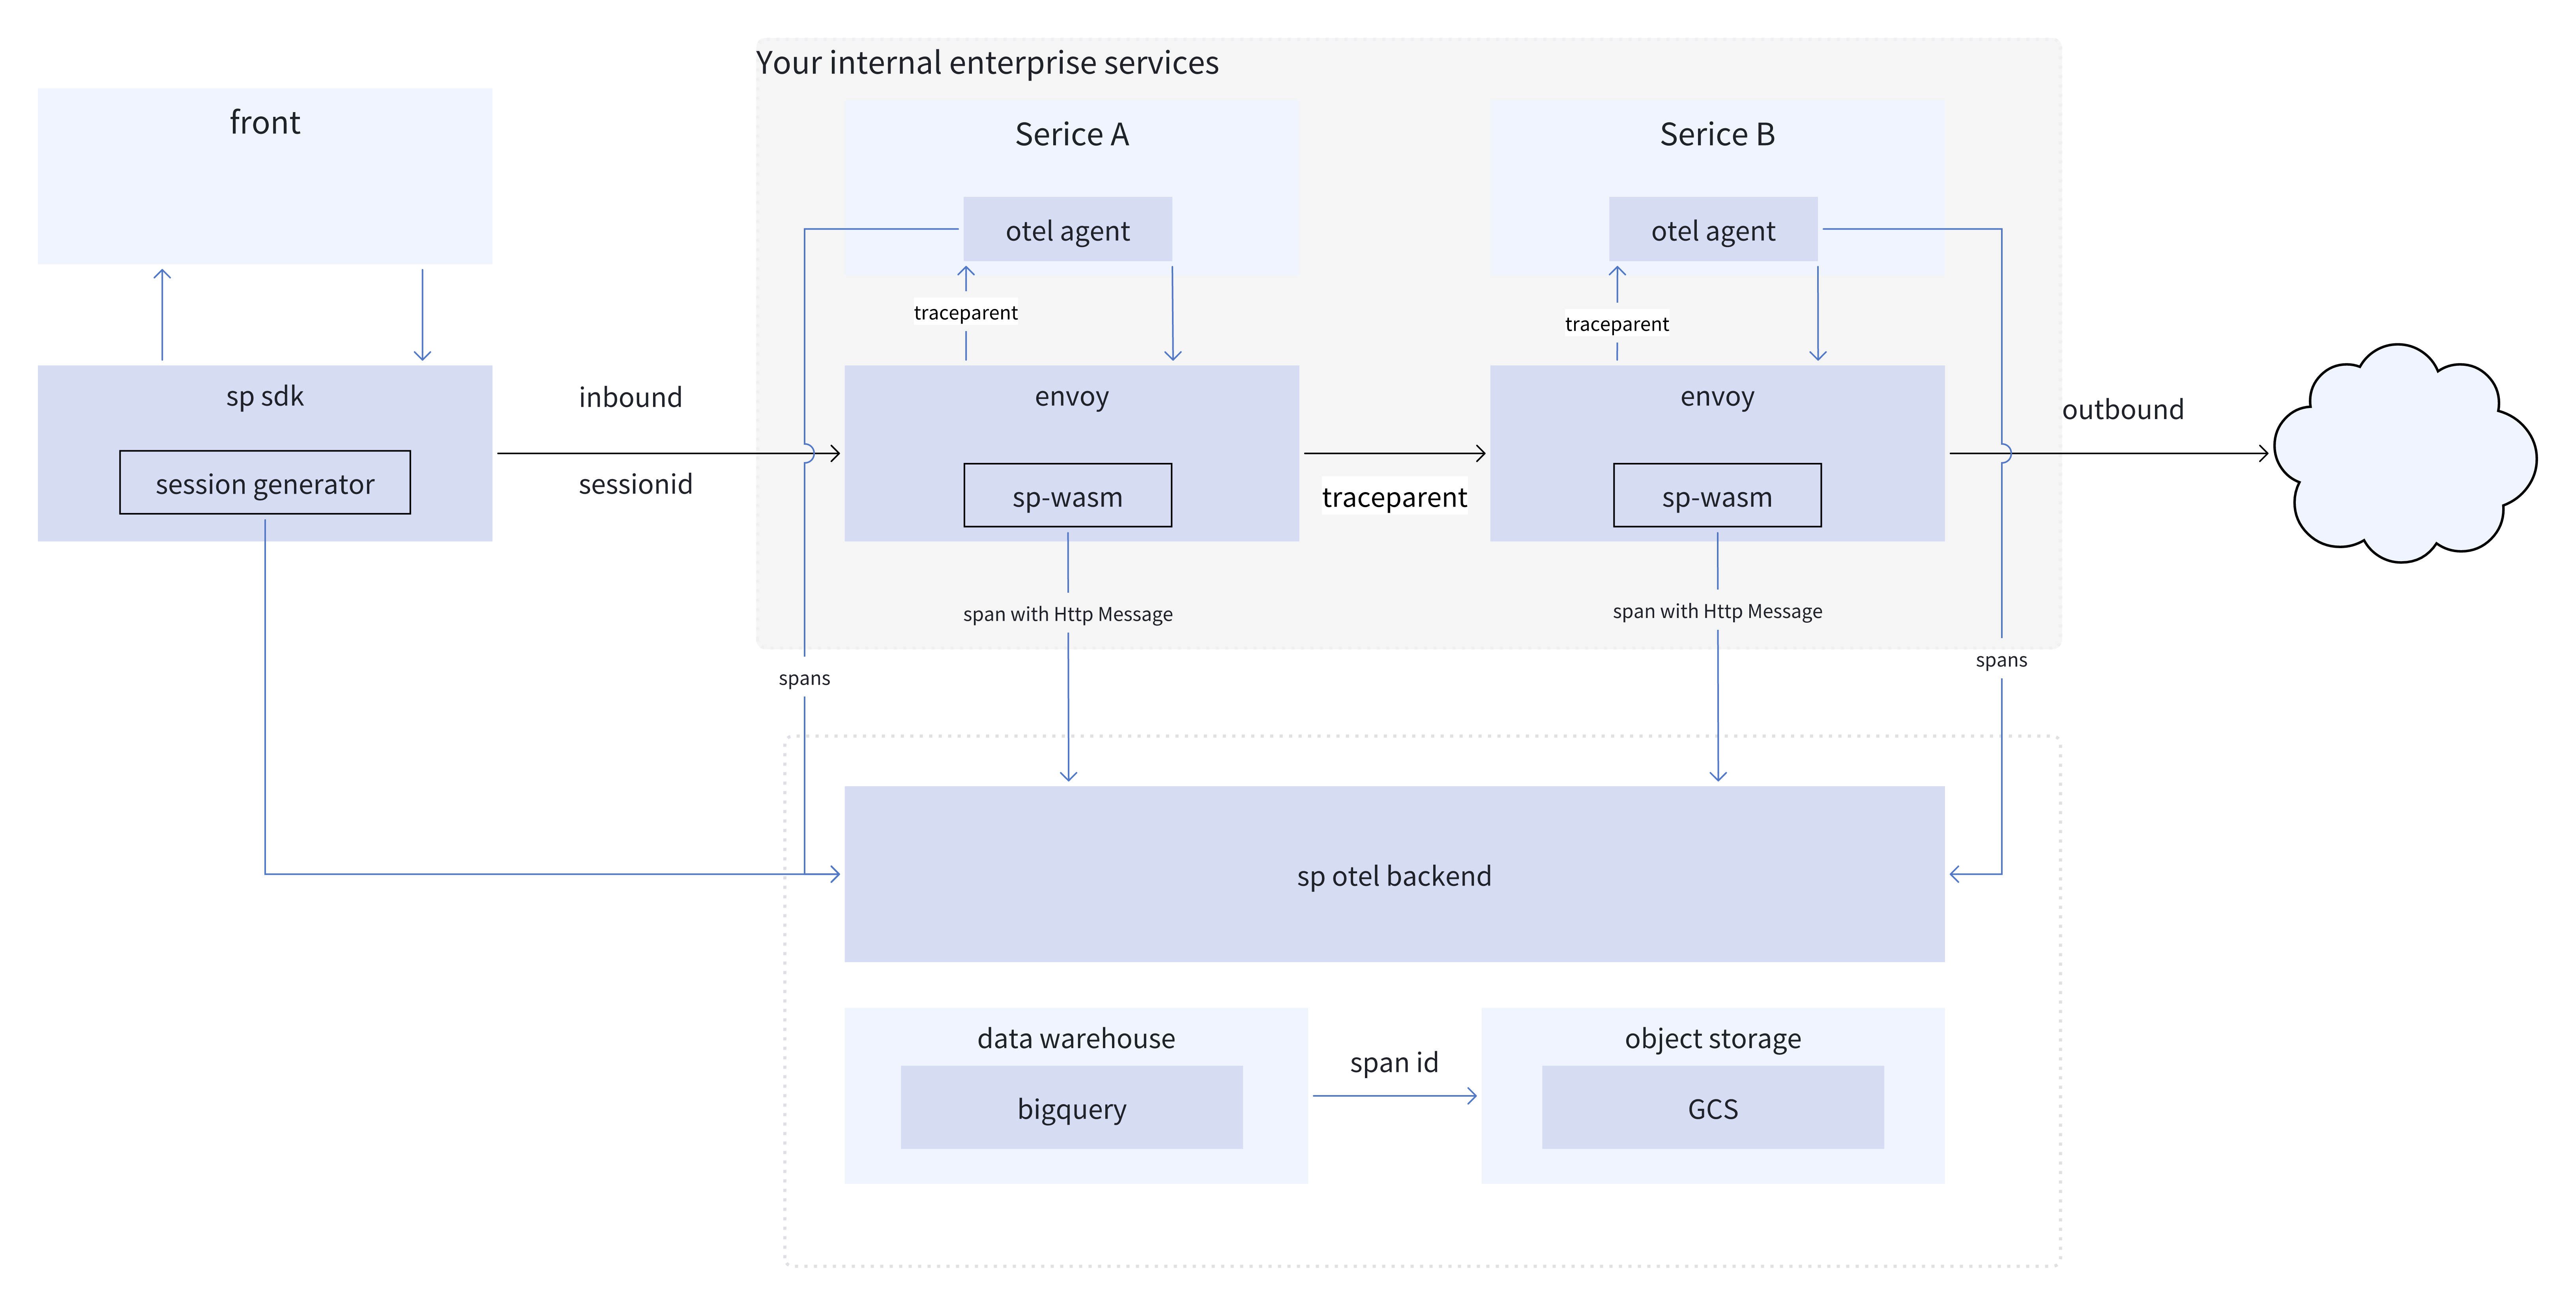
Key Components
1. SP-Istio Agent (Service Mesh Layer)
- WASM Plugin: Runs within Istio sidecars to capture service-to-service traffic
- Envoy Filter: Injects service identity headers and manages traffic capture
- Zero Code Changes: Works transparently with your existing applications
2. SESSIFY (Frontend Layer)
- Automatic Instrumentation: Captures user interactions, performance metrics, and errors
- Session Management: Generates a per-tab sessionId and reuses it across navigations within the same tab; all frontend telemetry carries the sessionId for end-to-end correlation with backend traces and logs
- Lightweight: Minimal performance impact on your web applications
3. Softprobe Backend
- Collectors: Receive and process observability data from all sources
- Processing Engine: Correlates, enriches, and stores telemetry data
- Dashboard: Visualizes insights and provides analytics capabilities
🔄 Data Flow
Request Journey Through Your System
- User Interaction: User interacts with your web application
- Frontend Capture: SESSIFY captures performance metrics and user actions
- Backend Request: Application makes service-to-service calls
- Mesh Capture: SP-Istio Agent captures traffic within the service mesh
- Data Enrichment: Service identity and context are added
- Transmission & Authentication: Data is sent to the Softprobe backend and authenticated using public key signatures
- Correlation & Analysis: Backend correlates frontend and backend data
- Visualization: Insights are displayed in the dashboard
Example: User Login Flow
1. User clicks "Login" button
   → SESSIFY captures click event

2. Frontend sends login request to backend
   → SESSIFY traces the API call

3. Backend service processes login
   → SP-Istio Agent captures service traffic

4. Backend calls user database
   → SP-Istio Agent captures database call

5. All data correlated by session ID
   → Softprobe shows complete user journey
🔐 Authentication & Data Transmission
Public Key Authentication
Softprobe uses asymmetric cryptography for authentication:
- No Secrets in Configuration: Your public key is not sensitive
- Cryptographic Proofs: Requests are signed and verified
- Easy Rotation: Public keys can be changed without downtime
- Audit Trail: Authentication events are logged
Data Handling & Transport
- TLS Encryption: Data is encrypted in transit
- No Sensitive Storage: SP-Istio Agent doesn't store sensitive data
- Least Privilege: Minimal permissions required for operation
- Policy-Compatible: Designed to work within common policies
🎯 Core Concepts
Distributed Tracing
Softprobe provides end-to-end tracing across:
- Frontend Applications: User interactions and browser performance
- Backend Services: Service-to-service communication
- External Dependencies: Database calls, external API requests
- Infrastructure: Kubernetes pod and node context
Service Mesh Integration
Leveraging Istio's capabilities:
- Automatic Sidecar Injection: No code changes required
- Traffic Capture: Both inbound and outbound traffic
- Service Identity: Automatic service discovery and naming
- Zero-Trust Policies: Works within service mesh policies
Observability Data Model
Softprobe captures and correlates:
- Spans: Individual operations within a trace
- Traces: Complete request journeys across services
- Metrics: Performance measurements and resource usage
- Logs: Application and infrastructure logs
- Events: User interactions and business events
⚡ Performance Considerations
Efficient Data Collection
- Sampling: Configurable sampling rates to manage data volume
- Body Capture Limits: Control payload sizes to minimize overhead
- Local Processing: Lightweight processing within the agent
- Batched Transmission: Efficient network utilization
Resource Optimization
- Memory Efficient: WASM plugins have minimal memory footprint
- CPU Lightweight: Optimized processing algorithms
- Network Efficient: Compression and batching of telemetry data
- Scalable Architecture: Handles high-volume production workloads
🚀 Getting Started Concepts
Development vs Production
- Development: Quick testing with local clusters and sample data
- Staging: Validate configuration with production-like environments
- Production: Full-scale deployment with optimized settings
Environment Strategy
- Separate Public Keys: Use different keys for each environment
- Targeted Deployment: Deploy to specific namespaces as needed
- Gradual Rollout: Start with monitoring, then add tracing and capture
📊 What to Expect
Immediate Benefits
- Service Dependency Mapping: Automatic discovery of service relationships
- Performance Baselines: Establish normal performance patterns
- Error Detection: Identify failing requests and services
- User Experience Insights: Understand real user behavior
Advanced Capabilities
- Root Cause Analysis: Drill down into performance issues
- Capacity Planning: Identify resource bottlenecks
- Business Metrics: Correlate technical data with business outcomes
- Proactive Monitoring: Alert on anomalies before users are affected
🔧 Integration Patterns
Microservices Architecture
Ideal for distributed systems with:
- Multiple interacting services
- Complex dependency graphs
- Cross-service troubleshooting needs
- Performance optimization requirements
Monolithic Applications
Also valuable for single applications with:
- Internal component tracing
- External dependency monitoring
- User experience correlation
- Performance optimization opportunities
Hybrid Environments
Works across diverse infrastructure:
- Kubernetes clusters
- Virtual machines
- Cloud services
- On-premises infrastructure
🎯 Next Steps
Now that you understand Softprobe's concepts:
- Set Up Your Account: Account Setup & Public Key Management
- Try Quick Start: Quick Start Guide for local testing
- Deploy to Production: Production Installation Guide
- Configure Advanced: Configuration Guide for custom rules
❓ Frequently Asked Questions
Q: Does Softprobe affect application performance?
A: The impact is minimal. SP-Istio Agent uses efficient WASM plugins and the SESSIFY is lightweight. Sampling can be configured to balance insight and overhead.
Q: How is my data transmitted and authenticated?
A: All data is encrypted in transit (TLS) and authenticated via public key signatures. No sensitive credentials are stored in your configuration.
Q: Can I use Softprobe with existing monitoring tools?
A: Yes. Softprobe complements existing tools by providing deeper distributed tracing and user experience correlation.
Q: How quickly can I see results after installation?
A: Immediately. Data starts flowing to the dashboard as soon as the agent is deployed and your applications receive traffic.
📚 Additional Resources
🆘 Support
Need help understanding concepts?
- Documentation: Browse our comprehensive guides
- Community: Join discussions with other users
- Support: Contact our team for technical assistance
Last updated: January 2024Version: v1.0