

Regression testing on every release
On every release, the pipeline takes real requests recorded in production and replays them against the new version in the test environment. If the results match production, the release continues. If they don't, the pipeline stops, and the report and chat notification say which endpoint changed. With AI set up, they also say which commit changed it.
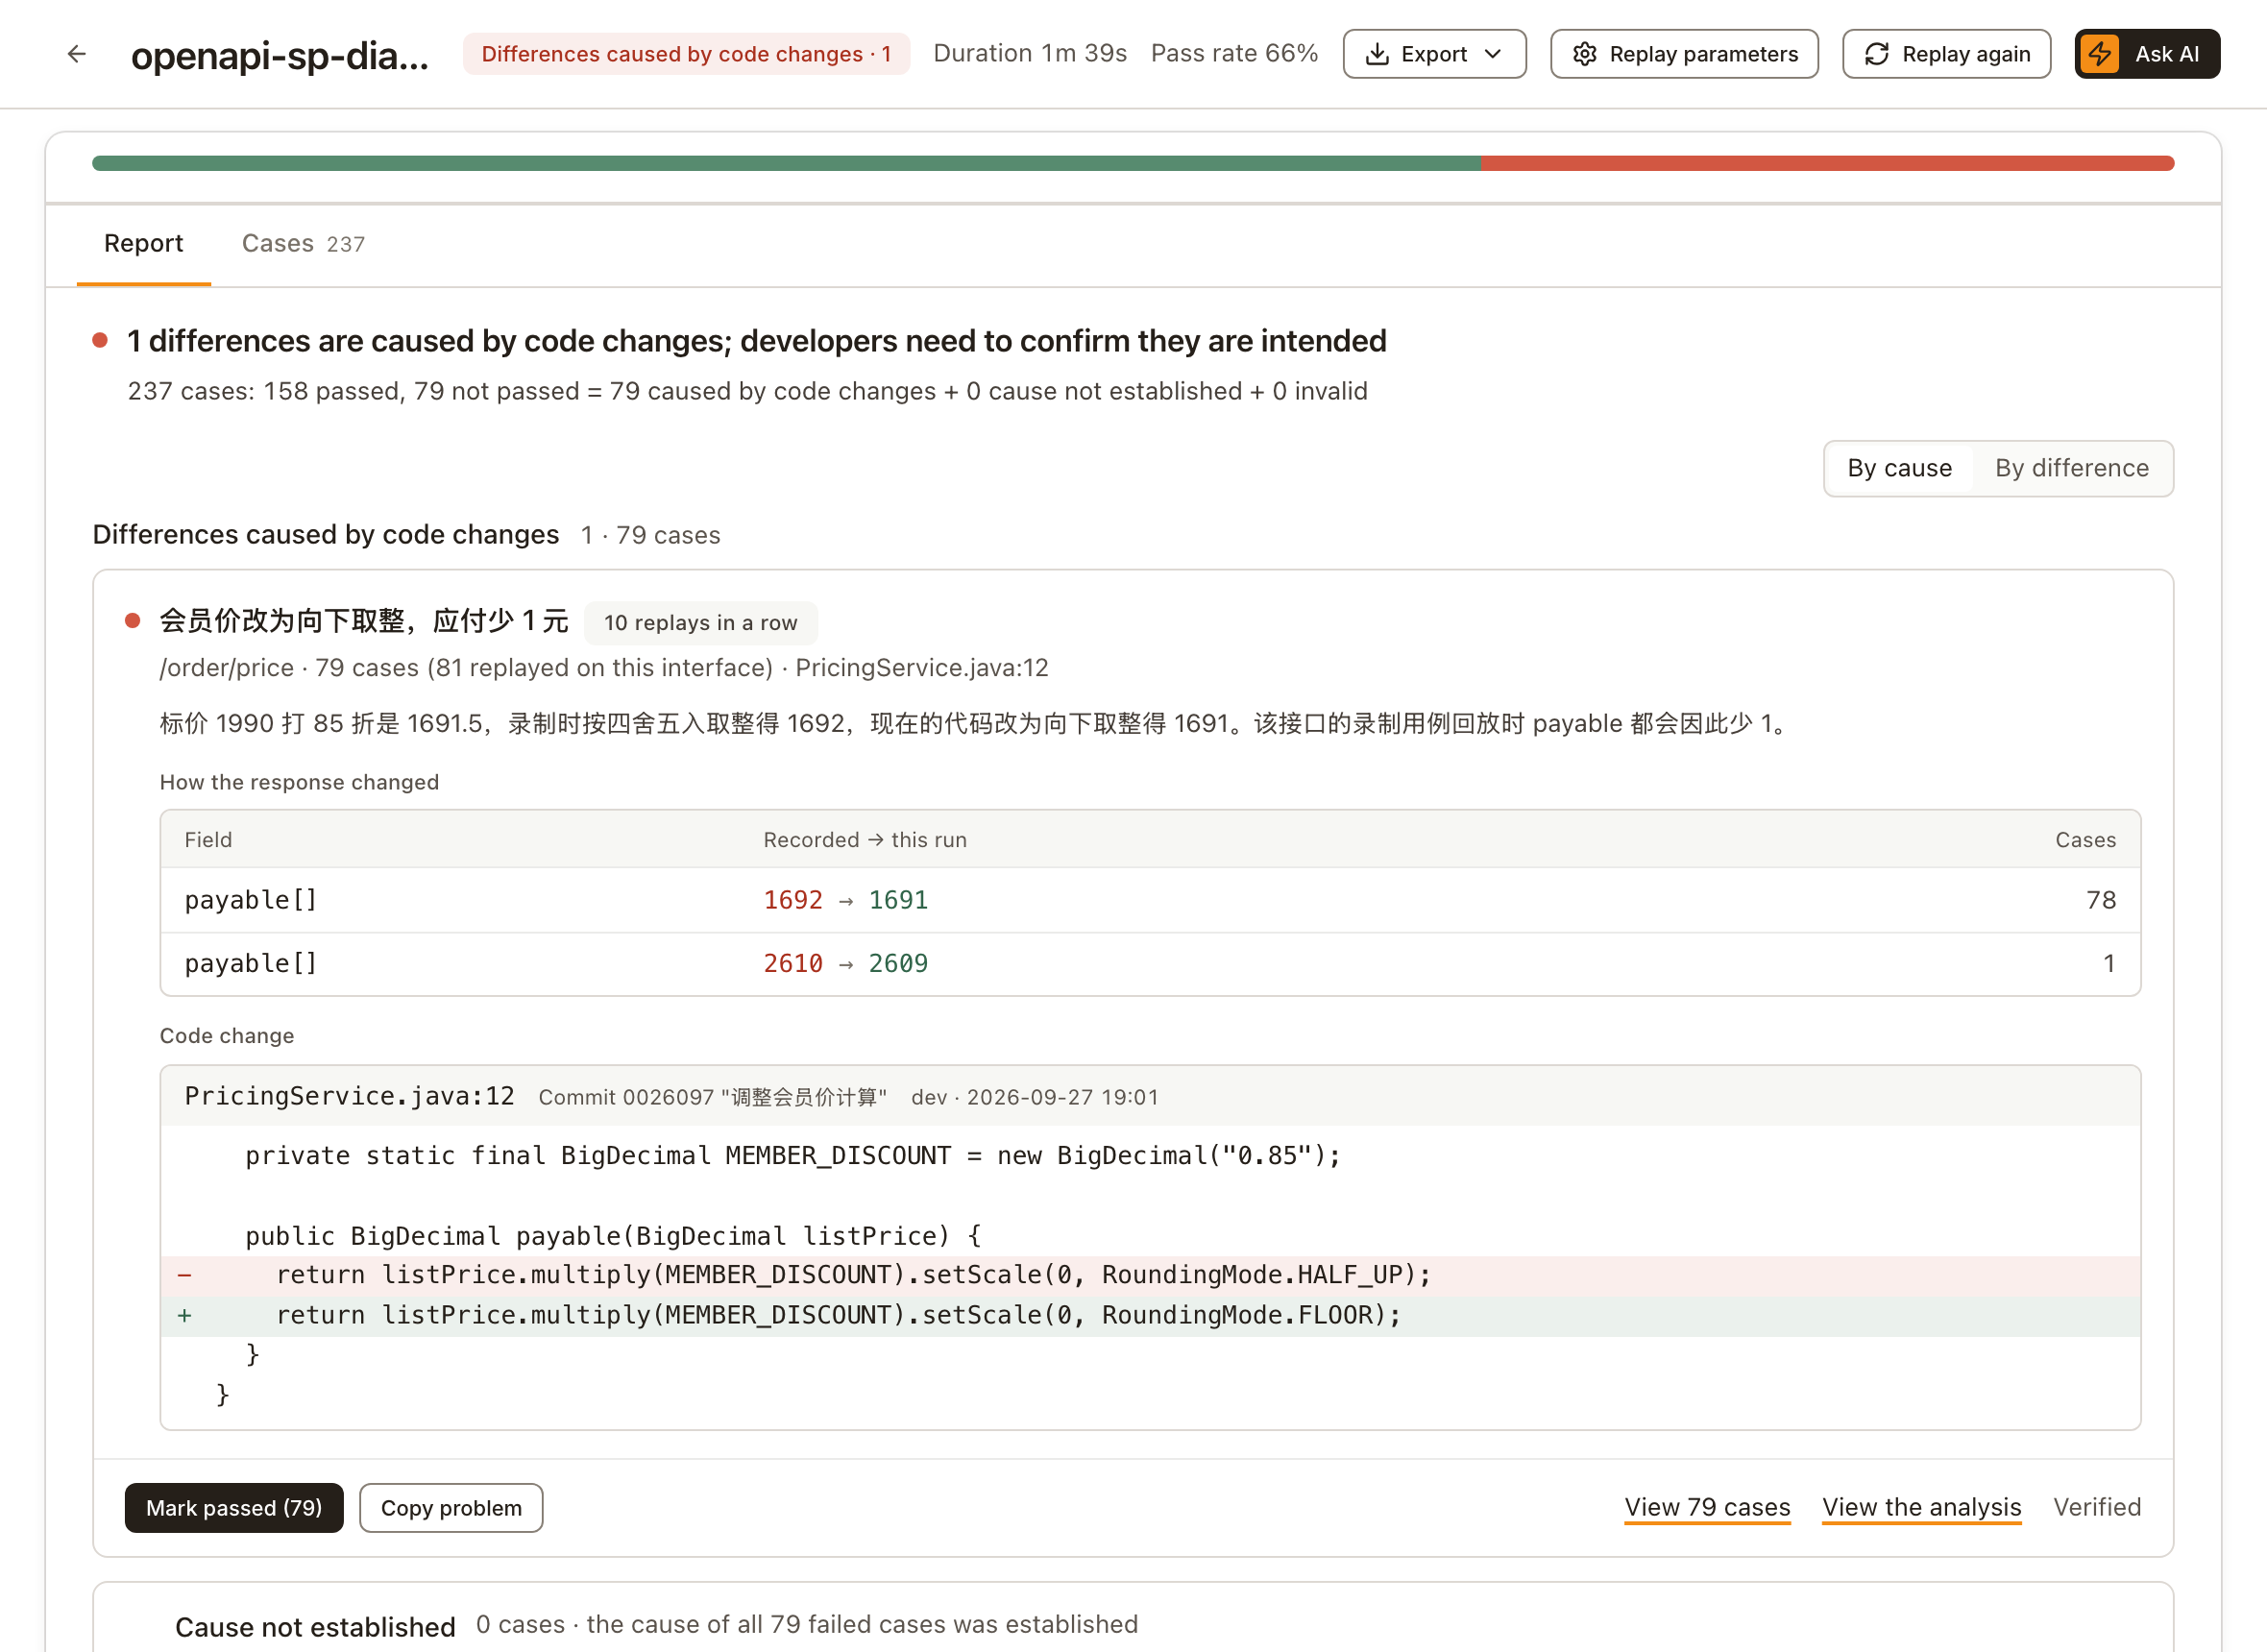
A real release
The screenshot above comes from this release:
The pricing service in production had been recording requests all along.
A developer committed
0026097("调整会员价计算", adjust the member price calculation), which changed member-price rounding from half up to rounding down.Once the new version was deployed to the test environment, the pipeline replayed the 237 requests recorded in production over the last hour (the report calls them "cases"). About 2 minutes later, the pipeline stopped with the result
NEEDS_ACTION, meaning results changed and someone needs to check:text回放结论:NEEDS_ACTION(The Chinese version of the script was used; the English one prints
Replay findings: NEEDS_ACTION.)The report: of the 81 requests replayed on
/order/price, 79 came back withpayable1 lower than in production. About 10 minutes after the pipeline stopped, the AI traced the difference to commit0026097changing the rounding, and to the changed line,PricingService.java:12; the notification channel then received the result and the analysis.The change wasn't intended. The developer reverted it and released again; this time the result was
CLEANand the release continued.
Had the change been intended, clicking Mark passed in the report and approving the release in the pipeline would have been enough.
This run used a demo environment: application ID sp-diag-e2e-app with 3 endpoints, production and test instances on one machine, production traffic simulated by a script, only the last hour of recordings replayed, and a Webhook as the notification channel. The AI wrote its analysis in Chinese. The 10 replays in a row label next to the difference in the screenshot is there because the demo environment had run the same change many times before; in a real project it wouldn't say 10 the first time.
What to set up
Prerequisite: SoftProbe is self-hosted. The SaaS edition can't yet trigger replays from a pipeline.
All of this is done once; after that, every release is tested automatically.
- Record in production: attach the agent to the service in production and add
-Dsp.tags.env=prodto its startup arguments, marking these as production recordings. See Attach the Java agent. - Test environment: attach the agent to the service in test as well, with the same application ID and
-Dsp.tags.env=test. The test environment shouldn't record, or replayed requests get recorded all over again: under Config → Recording, add a rule forenv=testwith the sample rate (requests recorded per minute) set to 0. See Recording settings. - List the endpoints that must be tested: the product calls them "main endpoints". Without this list, SoftProbe can only judge coverage by numbers: if a replay actually covers fewer than 10 endpoints or fewer than 30 requests, even an all-passing run ends up "coverage too low". So when few endpoints get replayed, the list is needed; once it exists, the check becomes whether every endpoint on it was tested. See Main endpoints.
- Set up AI (recommended): connect a model and bind the application's code repository. The report then automatically ignores fields that change on every run, such as timestamps and random IDs (AI noise reduction), and says whether a difference came from a code change. See Set up AI diagnosis and code repositories.
- Get one clean run first: deploy the version currently running in production to the test environment and run the script from the next section once. Go through the differences in the report: once a field such as a timestamp or random ID is confirmed to be noise that doesn't affect business behavior, add a diff rule to ignore it; run again until the result is
CLEAN. With this done, later releases won't keep getting stopped by the same noise. - Chat notifications: add a Feishu or DingTalk bot in the Notifications tab of settings. See Replay notifications.
Add it to the pipeline
After "deploy to the test environment" and before "release to the next environment", add a step that runs this script:
export SP_BACKEND=http://sp-backend.internal:8090   # SoftProbe backend address
export SP_APP_ID=order-service                      # Application ID
export SP_TARGET=http://order-service.test:8080     # The new version in the test environment
export SP_CASE_TAGS='{"env":"prod"}'                # Replay only production recordings
bash ci/softprobe-replay.sh
The script waits for the replay to finish, then lets the pipeline continue or stops it based on the result:
| Result | Pipeline |
|---|---|
CLEAN: no problems found | Continue the release |
NEEDS_ACTION, REVIEW_ONLY: results changed | Stop and read the report |
| Anything else: this release wasn't tested | Stop and find out why |
For the script's other settings (commit, branch, pipeline link, timeout) and how to write the step in Jenkins, GitLab CI and GitHub Actions, see Replay after deployment. Read its Before you start first: an All-in-One deployment needs SP_REPLAY_OPENAPI=true and a restart, and the machine running the script needs bash, curl and jq.
When the pipeline stops
- Results changed (
NEEDS_ACTION,REVIEW_ONLY): open the report and see what changed. If the change is intended, click Mark passed, then approve the release in the pipeline; if not, fix it and release again. - Too little tested (
LOW_COVERAGE,NO_CASES): too few requests were recorded in production, or main endpoints weren't replayed. Check that production is recording, thatSP_CASE_TAGSis right, and that the main endpoints are registered correctly. - Test environment problem (
ENVIRONMENT_FAILURE,INTERRUPTED): many endpoints failed the same way, or the replay didn't finish. First make sure the service in the test environment is up and reachable; when many endpoints all return 500, the new version itself may be failing. Rerun the pipeline once it's fixed.
How to read the report: Replay report.
FAQ
How long does the pipeline step take?
The replay itself, plus waiting for AI noise reduction. In the example above, the first run took about 2 minutes; the run after the fix passed completely, yet took about 8 minutes — 1 min 36 s of replay, and the rest waiting for AI noise reduction to wrap up. By default the script waits at most 30 minutes.
Why does the chat notification arrive later than the pipeline result?
The pipeline waits only for the replay and AI noise reduction, not for the AI to find the cause. When results changed and AI is set up, the notification waits for the AI analysis to finish (it is sent even if no cause is found), for up to 20 minutes, so it usually arrives a few to a dozen or so minutes after the pipeline result.
Does the AI always find the cause?
No. Differences whose cause isn't found are listed separately in the report as Cause not established. Also, the AI reads the code on the bound branch, so bind the branch that gets deployed to test. By default at most 10 analyses run automatically per day; if you release often, raise it in the report's flow settings.
After an intended change ships, will the next release report the same difference?
Yes, until the requests recorded from the old version in production fall out of the replay range (by default, recordings from the last 24 hours are replayed). Mark passed applies only to that one replay; the report labels the difference with how many runs in a row it has appeared, so it's easy to recognize.
Only want chat notifications when something is wrong?
Turn on Only on failure on the notification channel.