

Replay after deployment (CI/CD)
After a new version is deployed to a test environment, have the pipeline trigger a replay and let the result decide whether to continue. This page gives a general-purpose script, plus how to wire it into Jenkins, GitLab CI and GitHub Actions.
Get one replay working by hand first
A pipeline won't record cases for you. Follow Record traffic and Replay and diff to run one replay by hand, so you know the application has recordings and the test environment is reachable. Then hand it to the pipeline.
Before you start
Internal network only
The replay trigger endpoints (/openapi/v1/...) have no authentication. Anyone who can reach the backend can trigger replays and change notification channels. Only allow CI machines on your internal network to reach them, and never expose them to the internet.
- Self-hosted deployments only. SaaS doesn't expose these endpoints yet.
- The CI machine must reach the Softprobe backend, and the backend must reach the service under test. In a standalone deployment, CI calls the backend directly, on port 8090 by default.
- All-in-One deployments need forwarding turned on first. Set
SP_REPLAY_OPENAPI=truein the deployment's environment and restart the service (recreate the container for Docker). Until then, requests get a 404, a 405 or an HTML page. - A replay sends real requests to the service under test; downstream database, Redis and HTTP calls return recorded data. Point it at a test environment, never production. Turn recording off (or way down) where replays run, so replay traffic doesn't get recorded again.
- The machine running the script needs bash, curl and jq.
Step 1: Get the trigger endpoint
Open the Notifications tab in settings. Trigger replay from CI (OpenAPI) at the top shows the endpoint, plus a curl example filled in with the current application's appId, ready to copy.
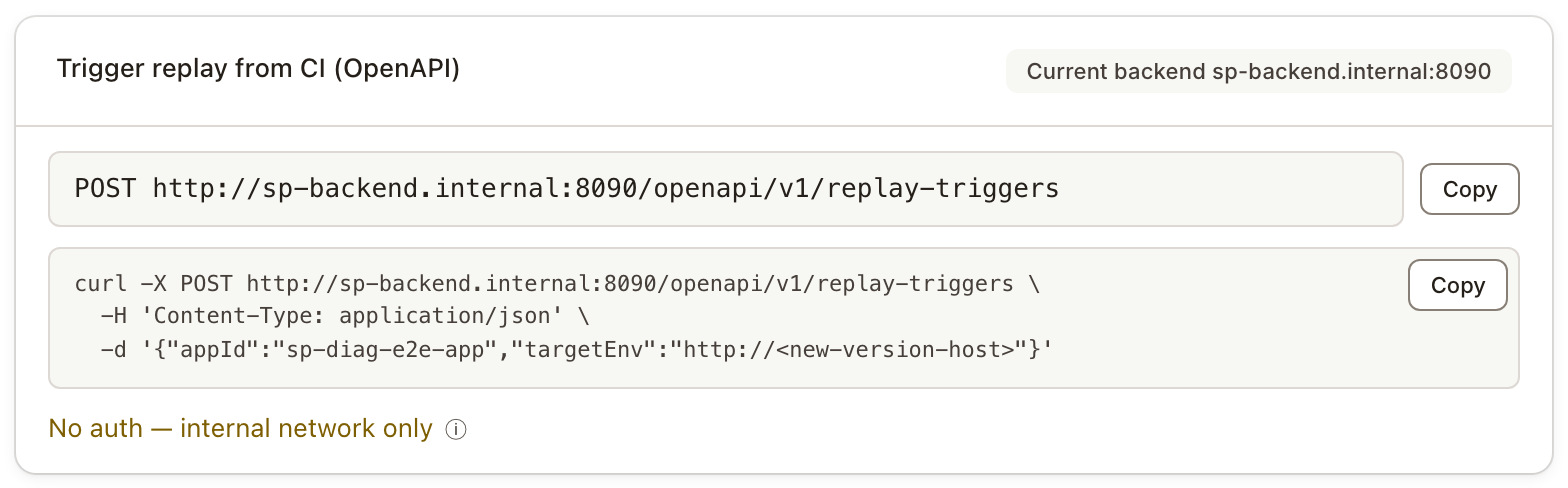
- The endpoint follows the environment selected at the top of the page. With several backends, switch to the one you want to replay against first.
- The page shows the backend's own address when it can. If the backend is only reachable on the local machine or inside the container network, it shows the address forwarded through this service instead, with a note on how to turn forwarding on.
- When going through this service and it has a login password, add
-u 'opencode:<password>'to curl. The script below calls the backend directly; if you switch it to the forwarded address, add this to both of its curl calls.
Step 2: Trigger the replay
Two parameters are enough: the application's appId and the address of the service under test, targetEnv.
curl -X POST http://sp-backend.internal:8090/openapi/v1/replay-triggers \
  -H 'Content-Type: application/json' \
  -d '{"appId": "order-service", "targetEnv": "http://order-service.test:8080"}'
The call returns right away; the replay runs in the background:
{
  "planId": "6abb8559e5eb34767296c557",
  "statusUrl": "/openapi/v1/replay-runs/6abb8559e5eb34767296c557",
  "errorCode": null,
  "errorMessage": null
}
When triggering fails, the HTTP status is still 200 and errorCode says why. For example, an endpoint path that was never recorded returns UNKNOWN_OPERATION, listing the paths it didn't recognize. See Replay trigger Open API for every error code.
Common parameters:
| Parameter | Description |
|---|---|
appId | Required. The application's appId. |
targetEnv | Required. The service under test, for example http://order-service.test:8080. |
operations | Replay only these endpoints, by path, as shown in the recording list, for example ["/order/create", "/order/pay"]. Leave it out to replay the whole application. |
caseSource | rolling (default) uses recent recordings; pinned uses pinned cases. Trigger the two separately and read each result on its own. |
caseSourceHours | How many hours of recordings to use, 24 by default. Doesn't apply to pinned. |
caseTags | Filter cases by the tags they were recorded with, for example {"env": "prod"}. Pass it when one application has recordings from several environments, so the test environment's own traffic isn't replayed back at it. |
attributes | Details about this deployment: commit, branch, pipeline run number and link, environment name. Shown on chat notification cards. |
The full parameter reference is in Replay trigger Open API.
Step 3: Wait for the replay to finish
Poll every few seconds:
curl http://sp-backend.internal:8090/openapi/v1/replay-runs/6abb8559e5eb34767296c557Keep waiting while status is PENDING or RUNNING. COMPLETED means the replay has finished and its findings are settled — not that it found no problems. For that, look at the findings. After the replay itself finishes, Softprobe waits for AI noise reduction to end before settling the findings; until then status stays RUNNING. Noise reduction being skipped or failing counts as ending; without AI deployed, the findings are settled 3 minutes after the replay finishes.
Step 4: Decide whether to continue
When the replay has finished, read findings.state in the response. Only CLEAN means the replay verified the deployment and found no problems.
findings.state | Meaning | What the sample script does |
|---|---|---|
CLEAN | Verified, no problems found | Continue (exit code 0) |
NEEDS_ACTION | Problems to fix, such as 500s or 404s, changed or missing fields, fewer downstream calls | Stop (exit code 1) |
REVIEW_ONLY | Only differences for someone to review, such as new fields, more downstream calls, or a 401 or timeout on a few endpoints | Stop (exit code 1); your team may decide to let these through |
LOW_COVERAGE | No problems found, but too few endpoints or requests were replayed to say anything about this deployment | Stop (exit code 2) |
NO_CASES | No requests to replay | Stop (exit code 2) |
INTERRUPTED | The replay didn't finish | Stop (exit code 2) |
ENVIRONMENT_FAILURE | At least 3 endpoints, and more than half of them, failed the same way — for example none could connect, or all returned 500. Usually a test environment problem | Stop (exit code 2) |
The response also has reportUrl, which opens this replay's report. Print it when the pipeline stops, so people can go straight to it.
Don't decide on the pass rate
A replay with a 95% pass rate may have broken the order endpoint; a replay with 100% may have covered only three endpoints. verdict and passRate in the response are based on the pass rate alone and can't replace findings.state.
Replaying just a few endpoints? Register the main endpoints first
Coverage is only checked once the replay finished normally and found nothing to fix or review. Without registered main endpoints, a replay covering fewer than 10 endpoints or fewer than 30 requests ends up LOW_COVERAGE, even if everything passes.
If you only want to smoke-test a few key endpoints after each deployment, register them as the application's main endpoints. After that, the coverage check looks at whether every main endpoint was replayed instead of at counts; nothing else changes. There's no UI for this yet; use the API:
curl -X POST http://sp-backend.internal:8090/api/config/schedule/modify/UPDATE \
  -H 'Content-Type: application/json' \
  -d '{"appId": "order-service", "mainOperations": ["/order/create", "/order/pay"]}'
Send an empty array, "mainOperations": [], to remove the registration.
The complete script
This script ties the four steps together: it triggers the replay, waits for it, and exits based on findings.state. Save it in your repository as ci/softprobe-replay.sh and call it from the pipeline.
| Exit code | Meaning |
|---|---|
| 0 | CLEAN, no problems found |
| 1 | NEEDS_ACTION or REVIEW_ONLY, problems to fix or review |
| 2 | Not verified (LOW_COVERAGE, NO_CASES, INTERRUPTED, ENVIRONMENT_FAILURE), the call failed, or it timed out |
#!/usr/bin/env bash
# Trigger a replay after deployment, wait for the result, and let findings.state decide
# whether the pipeline continues.
# Exit codes: 0 = no problems found (CLEAN); 1 = problems to fix or review;
#             2 = not verified, or the call failed.
set -euo pipefail

# Required: SP_BACKEND (Softprobe backend URL), SP_APP_ID (application appId),
#           SP_TARGET (URL of the service under test)
for name in SP_BACKEND SP_APP_ID SP_TARGET; do
  if [ -z "${!name:-}" ]; then
    echo "$name is not set"
    exit 2
  fi
done
case_source="${SP_CASE_SOURCE:-rolling}"   # rolling = recent recordings; pinned = pinned cases
timeout_seconds="${SP_TIMEOUT_SECONDS:-1800}"
if [[ ! "$timeout_seconds" =~ ^[1-9][0-9]*$ ]]; then
  echo "SP_TIMEOUT_SECONDS must be a positive integer"
  exit 2
fi

# 1. Trigger the replay. Build the body with jq so quotes in a branch name can't break the JSON.
if ! body=$(jq -n \
  --arg appId "$SP_APP_ID" \
  --arg targetEnv "$SP_TARGET" \
  --arg caseSource "$case_source" \
  --arg operations "${SP_OPERATIONS:-}" \
  --arg caseTags "${SP_CASE_TAGS:-}" \
  --arg hours "${SP_CASE_SOURCE_HOURS:-}" \
  --arg environment "${SP_ENVIRONMENT:-}" \
  --arg revision "${SP_REVISION:-}" \
  --arg branch "${SP_BRANCH:-}" \
  --arg runId "${SP_PIPELINE_RUN_ID:-}" \
  --arg runUrl "${SP_PIPELINE_RUN_URL:-}" \
  '{appId: $appId, targetEnv: $targetEnv, caseSource: $caseSource,
    attributes: ({"deployment.environment.name": $environment,
                  "vcs.ref.head.revision": $revision, "vcs.ref.head.name": $branch,
                  "cicd.pipeline.run.id": $runId, "cicd.pipeline.run.url.full": $runUrl}
                 | with_entries(select(.value != "")))}
   + (if $operations == "" then {} else {operations: ($operations | split(","))} end)
   + (if $caseTags == "" then {} else {caseTags: ($caseTags | fromjson)} end)
   + (if $hours == "" then {} else {caseSourceHours: ($hours | tonumber)} end)' 2>/dev/null); then
  echo "Bad input: SP_CASE_TAGS must be JSON and SP_CASE_SOURCE_HOURS a number"
  exit 2
fi

if ! resp=$(curl -sS --fail --max-time 30 -X POST "$SP_BACKEND/openapi/v1/replay-triggers" \
    -H 'Content-Type: application/json' -d "$body"); then
  echo "Trigger request failed; check SP_BACKEND and the network"
  exit 2
fi
if ! jq -e 'type == "object"' >/dev/null 2>&1 <<<"$resp"; then
  echo "Unexpected response. Usually the URL is wrong or /openapi forwarding is off"
  exit 2
fi
error=$(jq -r '.errorCode // empty | tostring' <<<"$resp")
if [ -n "$error" ]; then
  echo "Replay not triggered: $error $(jq -r '.errorMessage // empty' <<<"$resp")"
  exit 2
fi
plan_id=$(jq -r '.planId | strings' <<<"$resp")
if [ -z "$plan_id" ]; then
  echo "No planId in the response: $resp"
  exit 2
fi
echo "Replay triggered, planId=$plan_id"

# 2. Wait for the replay to finish. A single failed poll doesn't count; keep waiting until the timeout.
deadline=$((SECONDS + timeout_seconds))
while :; do
  run=$(curl -sS --fail --max-time 30 "$SP_BACKEND/openapi/v1/replay-runs/$plan_id" 2>/dev/null) || run=""
  status=$(jq -r '.status? | strings' 2>/dev/null <<<"$run") || status=""
  [ "$status" = "COMPLETED" ] && break
  if [ "$status" = "UNKNOWN" ]; then
    echo "Replay not found: $(jq -r '.errorCode // empty' <<<"$run")"
    exit 2
  fi
  if [ "$SECONDS" -ge "$deadline" ]; then
    echo "Replay still running after $timeout_seconds seconds, planId=$plan_id"
    exit 2
  fi
  sleep 10
done

# 3. Decide on the replay findings. Only CLEAN passes; the pass rate is not used.
state=$(jq -r '.findings.state? | strings' 2>/dev/null <<<"$run") || state=""
echo "Replay findings: ${state:-unavailable}"
echo "Report: $(jq -r '.reportUrl // "none"' <<<"$run")"
case "$state" in
  CLEAN) exit 0 ;;
  NEEDS_ACTION | REVIEW_ONLY) exit 1 ;;
  *) exit 2 ;;  # NO_CASES, INTERRUPTED, ENVIRONMENT_FAILURE, LOW_COVERAGE, or no findings
esac
The script reads these environment variables:
| Variable | Required | Description |
|---|---|---|
SP_BACKEND | Yes | Softprobe backend URL, for example http://sp-backend.internal:8090 |
SP_APP_ID | Yes | The application's appId |
SP_TARGET | Yes | URL of the service under test |
SP_OPERATIONS | No | Replay only these endpoints, comma-separated, for example /order/create,/order/pay |
SP_CASE_SOURCE | No | rolling (default) or pinned |
SP_CASE_SOURCE_HOURS | No | How many hours of recordings to use, 24 by default |
SP_CASE_TAGS | No | Filter cases by recording tags, as JSON, for example {"env":"prod"} |
SP_ENVIRONMENT | No | Environment name, shown on notification cards |
SP_REVISION, SP_BRANCH | No | This deployment's commit and branch |
SP_PIPELINE_RUN_ID, SP_PIPELINE_RUN_URL | No | Pipeline run number and link; the card's pipeline field links here |
SP_TIMEOUT_SECONDS | No | How long to wait, 1800 seconds by default |
The script never retries the trigger request: if the request timed out, the replay may already have been created, and a retry would run it twice.
Wire it into your pipeline
Run this step after the deployment to the test environment, once the service is up. The three examples below all just call the script; only the syntax differs.
Jenkins
stage('Softprobe replay') {
  environment {
    SP_BACKEND          = 'http://sp-backend.internal:8090'
    SP_APP_ID           = 'order-service'
    SP_TARGET           = 'http://order-service.test:8080'
    SP_ENVIRONMENT      = 'test'
    SP_REVISION         = "${env.GIT_COMMIT ?: ''}"
    SP_BRANCH           = "${env.BRANCH_NAME ?: ''}"   // BRANCH_NAME is only set in multibranch pipelines
    SP_PIPELINE_RUN_ID  = "${env.BUILD_NUMBER}"
    SP_PIPELINE_RUN_URL = "${env.BUILD_URL}"
  }
  steps {
    sh 'bash ci/softprobe-replay.sh'
  }
}
GitLab CI
softprobe-replay:
  stage: verify            # declare it in stages, after the stage that deploys to the test environment
  tags: [intranet]         # a runner that can reach the internal network
  variables:
    SP_BACKEND: http://sp-backend.internal:8090
    SP_APP_ID: order-service
    SP_TARGET: http://order-service.test:8080
    SP_ENVIRONMENT: test
    SP_REVISION: $CI_COMMIT_SHA
    SP_BRANCH: $CI_COMMIT_REF_NAME
    SP_PIPELINE_RUN_ID: $CI_PIPELINE_ID
    SP_PIPELINE_RUN_URL: $CI_PIPELINE_URL
  script:
    - bash ci/softprobe-replay.sh
GitHub Actions
GitHub-hosted runners live on the public internet and can't reach a backend on your internal network, so use a self-hosted runner inside it.
jobs:
  softprobe-replay:
    needs: deploy-test               # the job that deploys to the test environment
    runs-on: [self-hosted, intranet]
    steps:
      - uses: actions/checkout@v4
      - name: Softprobe replay
        env:
          SP_BACKEND: http://sp-backend.internal:8090
          SP_APP_ID: order-service
          SP_TARGET: http://order-service.test:8080
          SP_ENVIRONMENT: test
          SP_REVISION: ${{ github.sha }}
          SP_BRANCH: ${{ github.ref_name }}
          SP_PIPELINE_RUN_ID: ${{ github.run_id }}
          SP_PIPELINE_RUN_URL: ${{ github.server_url }}/${{ github.repository }}/actions/runs/${{ github.run_id }}
        run: bash ci/softprobe-replay.sh
AI cause analysis
Replays triggered by CI is on by default in flow settings: once the replay and AI noise reduction are done, the server analyzes the failing cases and writes the result into the replay report.
- The pipeline doesn't need to wait for the analysis;
findings.stateis enough to decide. analysisin the polling response summarizes the result, such as how many cases' differences were caused by code changes. It never changesfindings.state, so an AI mistake can't let a pipeline through. If you want to decide on whether code changes caused differences, readanalysisyourself; its fields are in Replay trigger Open API.
Send results to chat
Replay results can be posted to a Feishu group, a DingTalk group, or your own webhook. Only replays triggered through the endpoints on this page are posted. See Replay notifications.
Troubleshooting
| Symptom | Cause and fix |
|---|---|
| An HTML page, a 404 or a 405 comes back | The URL is wrong; for All-in-One, check that SP_REPLAY_OPENAPI=true is set |
APP_NOT_REGISTERED | operations was given, and the appId is wrong or the application hasn't recorded any traffic yet |
UNKNOWN_OPERATION | An endpoint path doesn't match what was recorded; the response lists which |
The result is NO_CASES | Nothing was recorded in that time range, or caseTags filtered out every case |
The result is always LOW_COVERAGE | See Register the main endpoints first |
The result is ENVIRONMENT_FAILURE | Check that the service under test is up, the address is right and the network is open. If many endpoints return the same status code (say 500), the application itself may be failing; open the report |
| The script times out | Many cases or a slow service. Raise SP_TIMEOUT_SECONDS, or narrow the scope with SP_OPERATIONS |
Other ways to trigger a replay
The two methods below can also start a replay, but they don't send notifications. For new pipelines, use the endpoints above.
GET /api/createPlan
Creates the replay plan and returns without waiting:
curl -G http://sp-backend.internal:8090/api/createPlan \
  --data-urlencode "appId=order-service" \
  --data-urlencode "targetEnv=http://order-service.test:8080"
On success, data.replayPlanId is the planId. It uses the last 24 hours of recordings by default; change the range with caseSourceFrom and caseSourceTo (timestamps in milliseconds). Once you have the planId, you can check the result with the endpoint from Step 3.
The sp command
sp replay run --app order-service --env http://order-service.test:8080 \
  --suite Pinned --name "ci-${BUILD_NUMBER}" --watch --json
--suite Pinned replays only the cases you pinned by hand. See the replay command.