

Your first record and replay
On a Softprobe that's already deployed: attach a Java service, record a few requests, replay them once in a test environment, and read the report. Everything is done in the console; each step also shows the matching sp command.
Pick how you work
Each card below has a switch at the top between the console and the command line. The site remembers your choice.
Before you start
- The console URL and the backend URL. On a single-server (All-in-One) deployment both are port
8090of the platform server, for examplehttp://10.0.0.5:8090. No platform yet? See Choose a deployment. - A Java service you can restart, on JDK 8, 11, 17 or 21, preferably in a test environment. Supported frameworks: Supported frameworks.
- The service's host can reach the backend, and the backend can reach the service's business port (replay sends requests to it).
- For the command line: install sp, point it at the same backend and authenticate. The service's
-Dsp.api.urlflag is for the agent only; it doesn't configure the command line.
1. Attach the service
First get sp-agent.jar:
In the console, open Applications (bottom left), click Connect new application, and download sp-agent.jar from the wizard. Or download it from the console on the service's host:
curl -fL -o sp-agent.jar http://<console-host>/api/agent/sp-agent.jarThen add three flags to the service's start command and restart it:
java -javaagent:/path/to/sp-agent.jar \
     -Dsp.app.id=order-service \
     -Dsp.api.url=http://<backend-host>:8090 \
-jar order-service.jarsp.app.idis the service's application ID in Softprobe. Pick a stable name; it's registered on first start. All instances of one service use the same ID.sp.api.urlis the backend URL and must includehttp://orhttps://.
Tomcat, Docker, Kubernetes and other setups: Attach the Java agent.
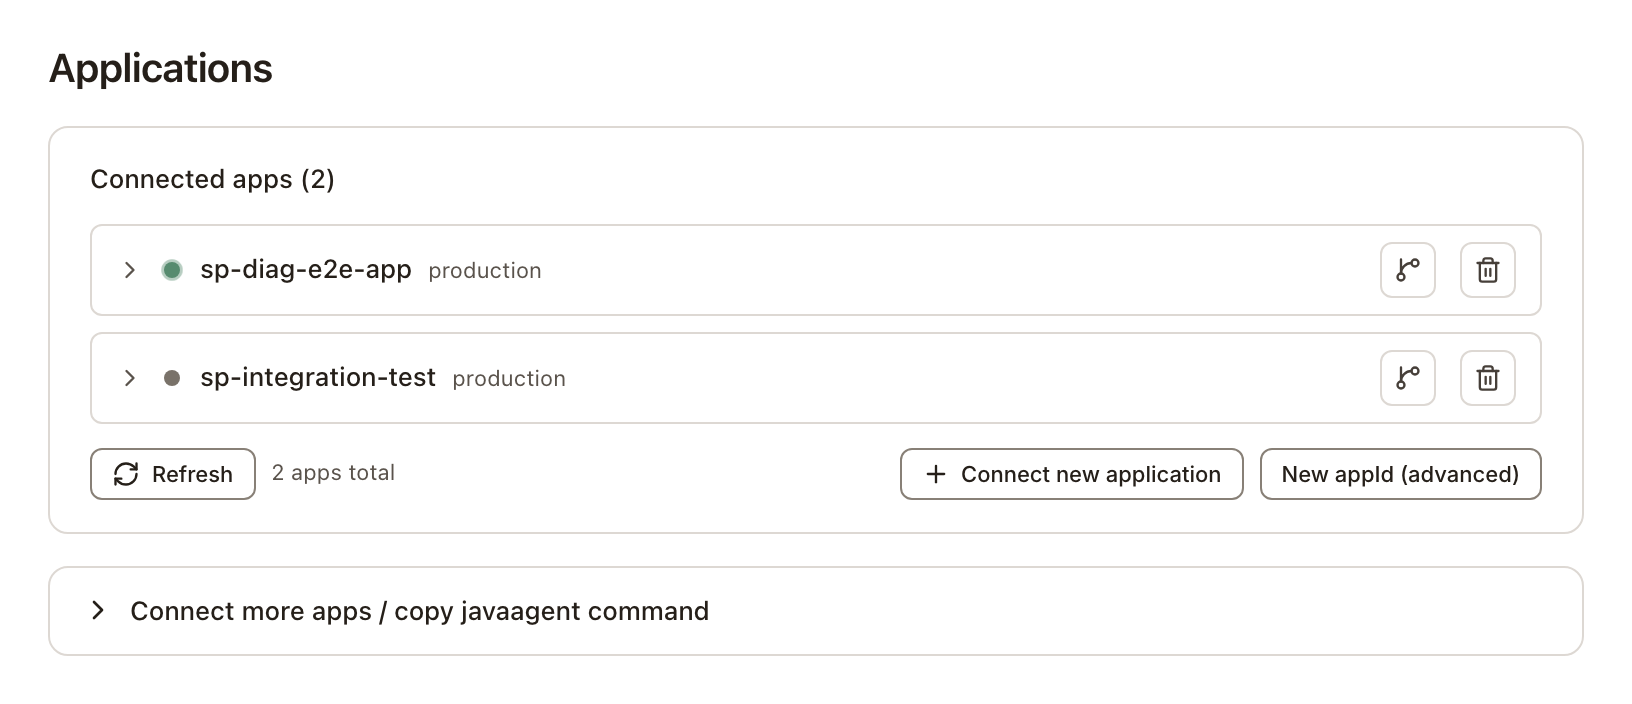
Once the service is up, go back to Applications. When order-service is listed as Agent online, it's attached.
2. Record a few requests
Call the service's endpoints as you normally would; a few business requests are enough. By default each endpoint records about one request per minute, so send a few and wait a minute or two.
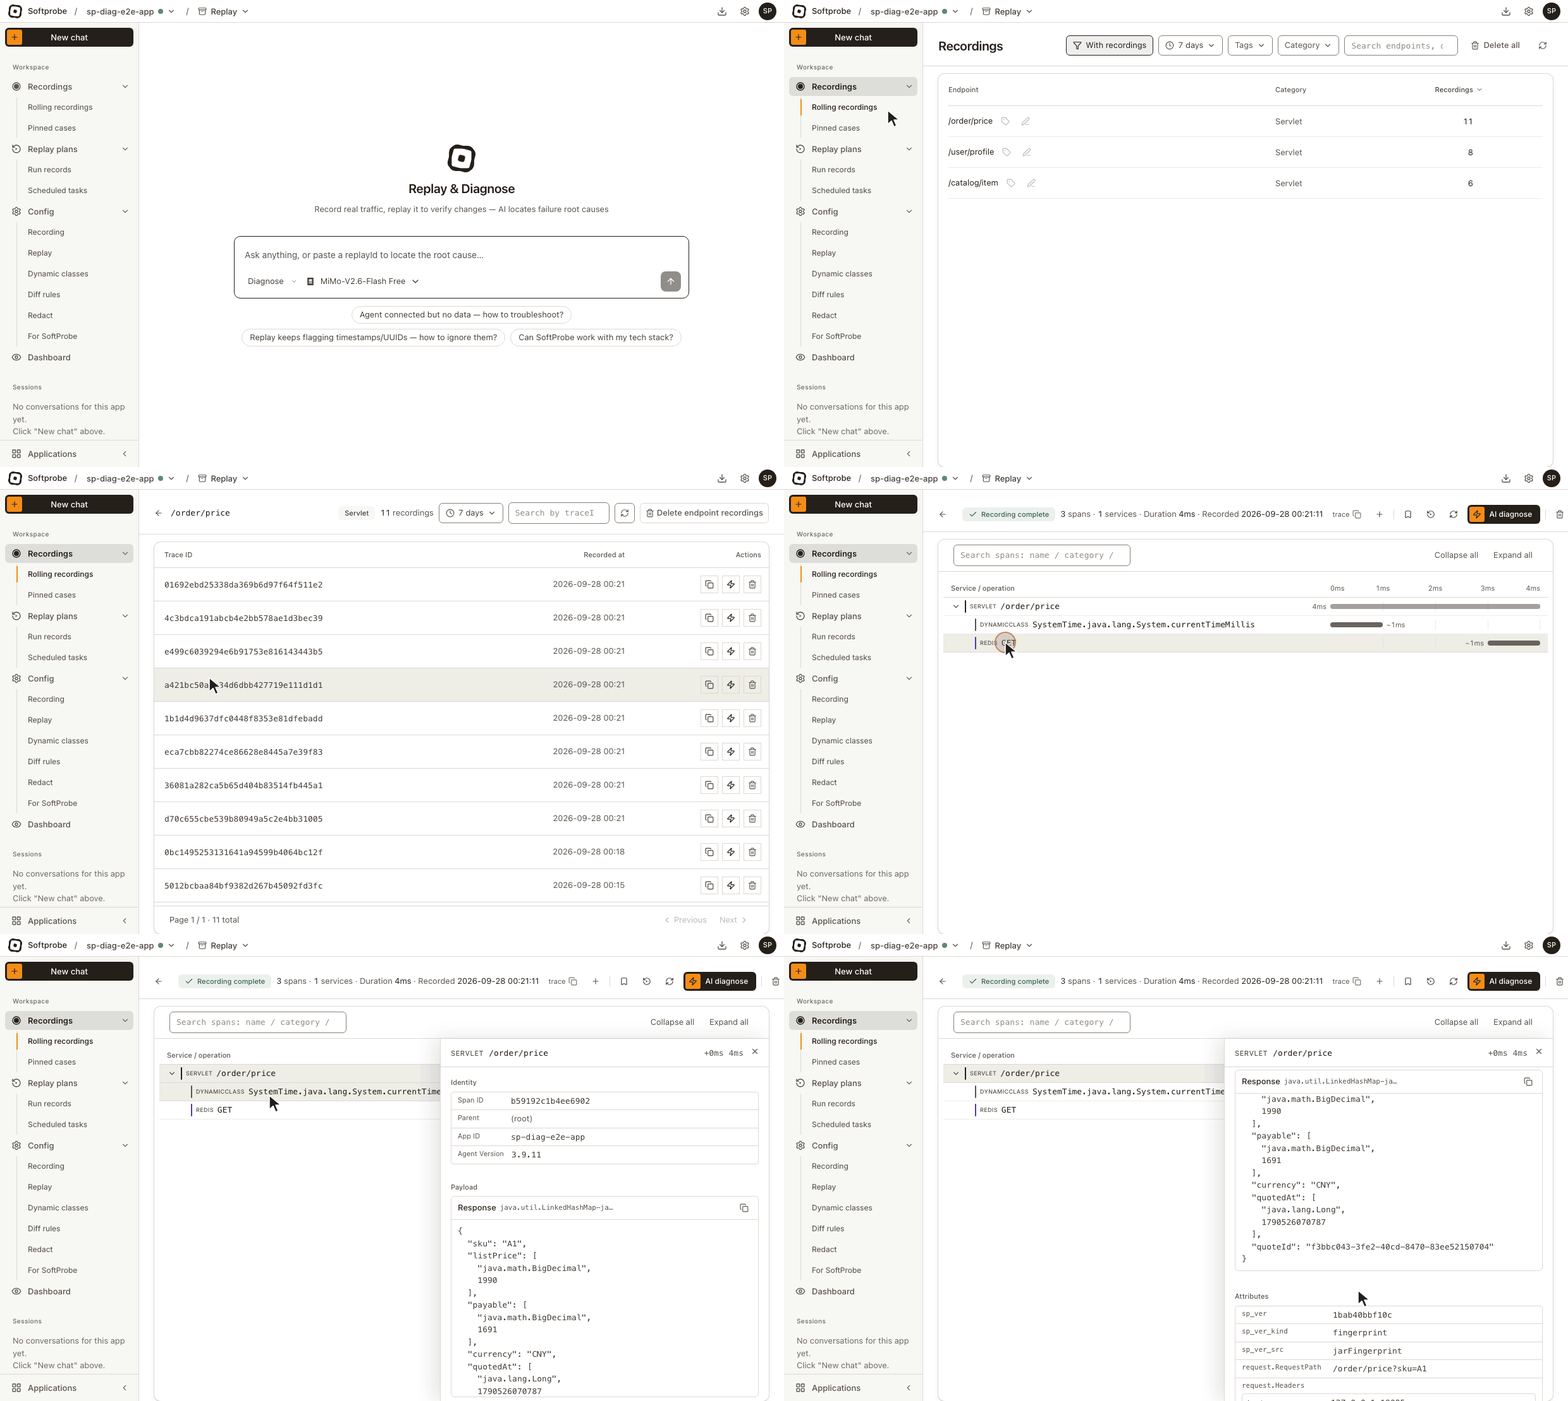
Select order-service at the top and open Recordings → Rolling recordings. The list sums recordings per endpoint; click an endpoint to see each recording, then View trace recording to see which databases, caches and downstream endpoints the request called.

Reading recordings, and what to check when nothing is recorded: Recordings.
3. Replay in a test environment
Start the changed version in a test environment, also with the agent and the same sp.app.id. Note its address, for example order-service.test:8080.
Replay against test, not production
Replay really sends the recorded requests to the target service. Point it at a test environment.
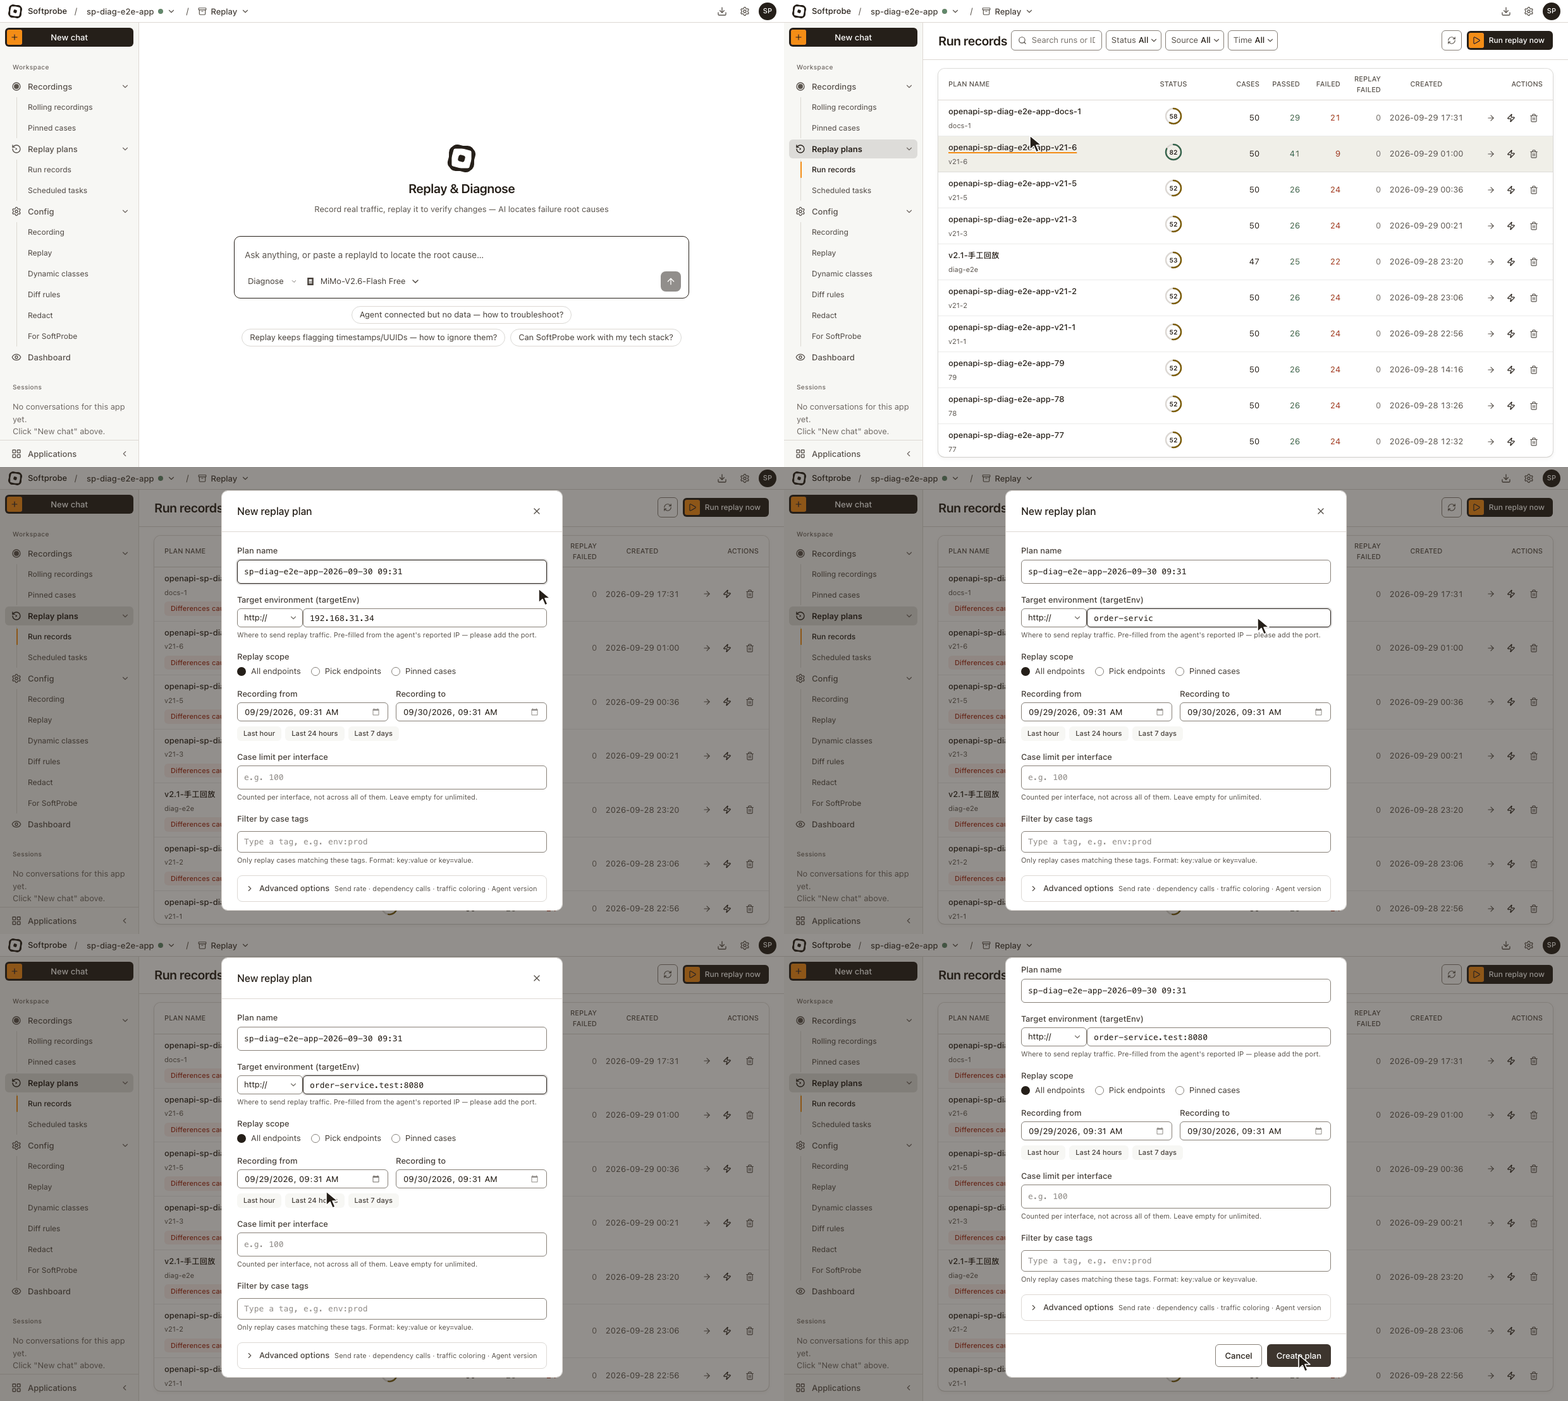
- Open Replay plans → Run records and click Run replay now.
- Under Target environment (targetEnv), pick
http://and enterorder-service.test:8080. - Leave Replay scope on All endpoints, and set Recording from to Last 24 hours.
- Click Create plan. The run appears in Run records and goes from Running to its final result, such as All passed or Differences.
4. Read the replay report
Open the run from Run records and switch to the Report tab. The first line is the conclusion. When the replay has been analyzed by AI, the cases that didn't pass are listed below it as Problems (caused by code changes), Cause not established and Other results. Start with Problems and confirm whether each change was intended.
How to read the report: Replay report. Going through differences one by one and removing noise: Review differences.
Next
- Recordings: the recording list, call chains, and what to check when nothing is recorded
- Pinned cases: keep important recordings and replay them again and again
- Run and schedule replays: replay scope, rate, and a nightly replay
- Recording and replay settings: sampling, and which dependencies are answered from the recording
No service of your own? Try the demo app
With the sp command line installed, sp demo starts a demo app (Travel OTA) with the agent attached in Docker on your machine, sends it some traffic and replays it:
sp demo start --watch
sp demo traffic
sp demo replay --watch
If the backend is Softprobe Cloud and the demo app runs on your machine, run sp tunnel in another terminal. Command reference: sp demo.